How to Trade the Broadening Wedge Pattern
The broadening wedge has always been a bit of a mystery to me. While it can be quite a profitable pattern, it has a tendency to play tricks on us traders if we’re not careful.
Broadening wedges occur somewhat less frequently than its relative, the narrowing wedge, and as such many traders find it a little more difficult to spot these patterns as they occur.
Another issue that many seem to encounter is calculating the measured move profit target, which confuses traders.
Regardless of these little instances of trickery, let’s find out how to spot the most profitable broadening wedge patterns and go through the best way to trade them. Before we do, however, let’s define a broadening wedge pattern.
What’s a Broadening Wedge?
Broadening wedges are quite similar to flag patterns, in that they are an indication of exhaustion by either bulls or bears.
The shape of these wedges can form sideways without much of a convincing directional bias, or alternatively on occasion they can appear in an ascending or descending manner.
As the name suggests, the broadening wedge gets wider toward the right side, kind of like a megaphone.
While this is typically a pattern that represents consolidation, it’s a bit sloppy in the sense that it has wider swings and isn’t as nice and tight as we’d expect from other consolidation patterns.
The illustration below outlines the characteristics of broadening wedge patterns.
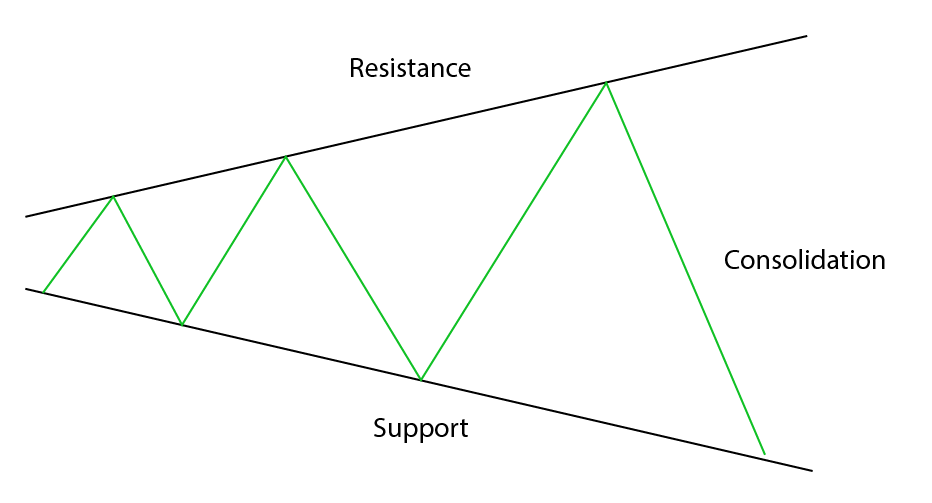
You’ll see that we still have similar characteristics of support and resistance while forming a consolidation. And of course, as implied the wedge gets wider as the chart forms more right side.
The characteristics of these wedges are the same regardless of whether they’re forming a bottom or top of a trend.
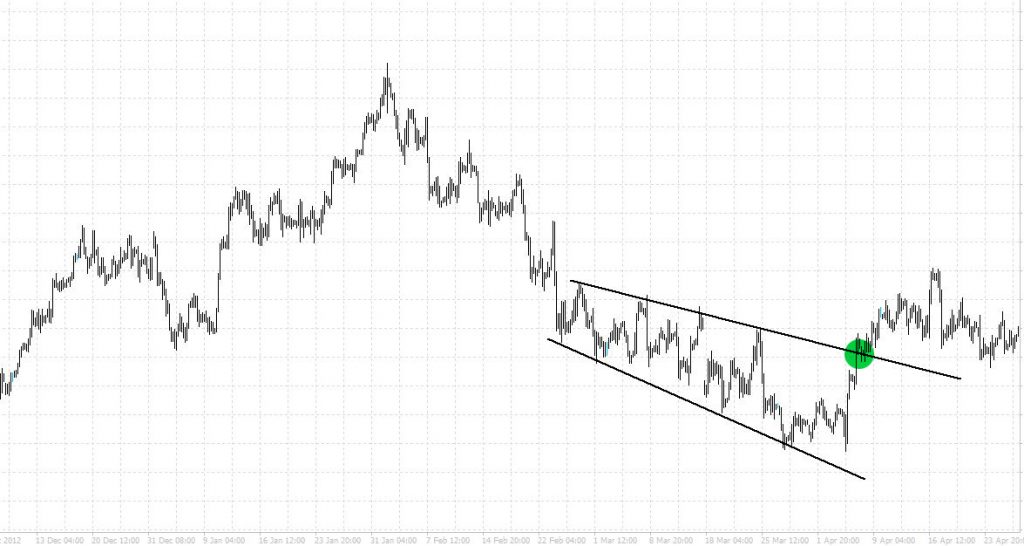
Let’s have a look at a wedge on a chart.
Now, that was a difficult example to find as you can probably guess from the date of the chart. And admittedly, it’s not the best example either although you can get the gist of what I’m talking about here.
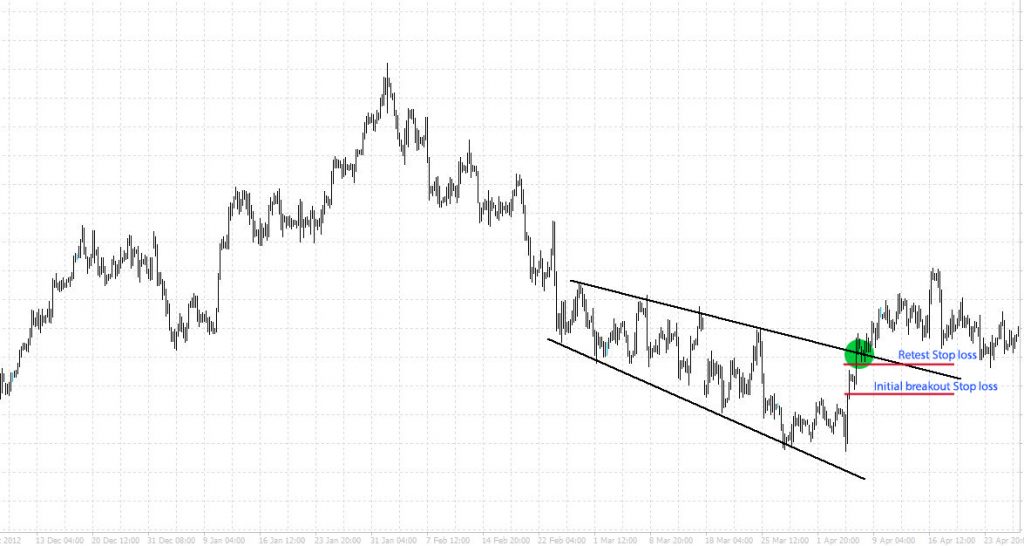
You can see the trendlines widening as the consolidation occurs, followed by a clear break through the line of resistance. This breakout was good for a bit over 220 pips with a stop loss of just under 100 pips, or about 60 pips SL if you trade the retest as opposed to the initial breakout.
On that note, let’s talk about how to trade these broadening wedges.
How to Trade Broadening Wedges
Like everything to do with Forex trading, these patterns require patience. They are quite rare in comparison to a lot of other chart patterns… so much so that I struggled to find a solid example where price truly rocketed from the breakout, and instead could only find one with a modest, while textbook, profit target.
That, however, is not the component that requires patience, it takes strict patience in waiting for the pattern to play out, confirm and the secure a suitable entry.
With that in mind, let’s discuss strategies.
As with all patterns, the very first thing to do is WAIT for the confirmed breakout. That folks, means the close of the candle. I can’t emphasize this enough when it comes to trading price action patterns. Now, once this occurs, you can simply buy or sell or alternatively wait for a retest of the breakout level for an even tighter stop loss.
Simple, right?
Check out a suitable stop loss placement below.
So, as mentioned and outlined by the picture above, you can either trade the confirmed breakout, or wait for the retrace, the latter offering a more favourable risk:reward ratio.
It’s really up to each individual trader which entry method they prefer as each has its advantages and disadvantages, so just go with the method that works best for you.
How to Determine Profit Targets
Just as there are a couple of entry methods, so too are there a couple of methods to identify potential profit areas.
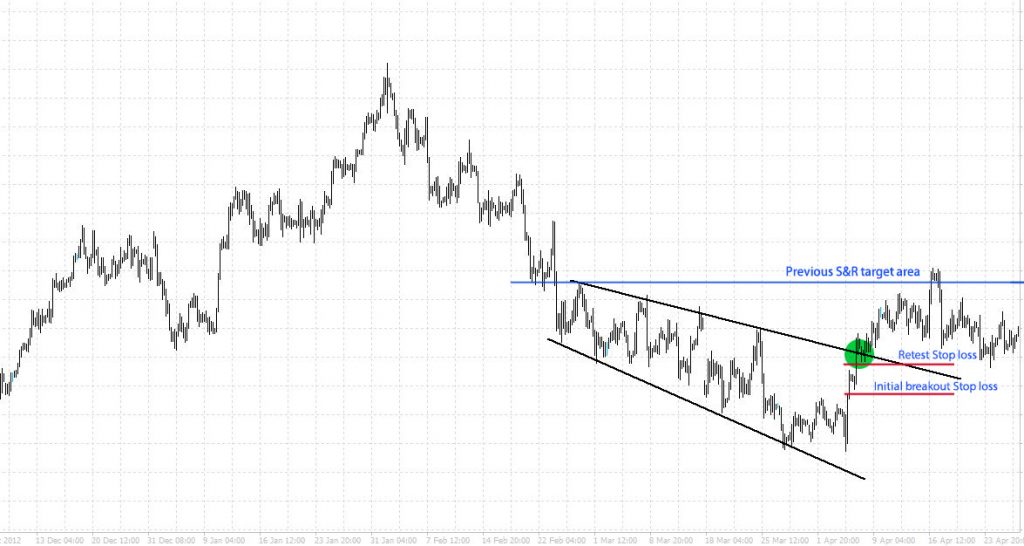
First, and my favourite, is simply using horizontal support and resistance levels as indicated below.
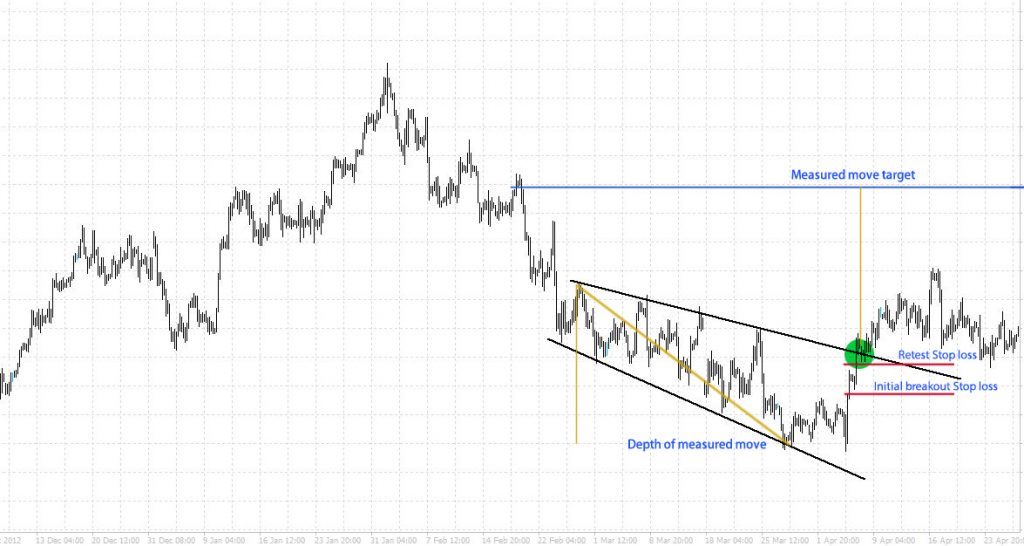
Second, we have the measured move approach where you take the height of the pattern, and apply it above/below the breakout depending on the breakout direction.
In this particular instance, price failed to reach our measured move target area. But folks, that’s the nature of trading… absolutely nothing is certain. That said, both target area methods are valid, though as mentioned previously I always place greater emphasis on proven areas of support and resistance.
Saying that, I still always consider the measured move target areas and then look to see if there are significant support or resistance areas prior to that measured move target area. On occasion if there’s no S&R in the way of the measured move target area I’ll let it run, and take a bit off the table as it moves.
Wrapping up
These broadening wedge patterns don’t show up too often, but when they do, it’s worth paying attention to them, because not only are they easily tradable, but they are a brilliant method of spotting the exhaustion of a trending market.
I know I sound like a dripping tap, but it is well worth reiterating that as with all Forex price patterns that we trade, you need to wait for the pattern to be confirmed by the closing candle. Then, and only then is the pattern valid and tradable.
The retest of the broken level certainly offers a more attractive risk level, but as I’m sure you’re aware, there’s never a guarantee that price will retest the breakout area, leaving you behind.
Fast & easy account opening
-
Register
Choose an account type and submit your application
-
Fund
Fund your account using a wide range of funding methods.
-
Trade
Access 300+ CFD instruments across all asset classes on MT4 / MT5
That's it, it's that easy to open a Forex and CFD trading account.
Welcome to the world of trading!
open live account


