Analysing Chart Patterns: Head and Shoulders
As technical forex traders, we use the price history of a given instrument, and the particular shapes and patterns that occur as our basis for not only taking a trade, but determining our risk and profit areas too. While the jury is still out there as to whether it’s an attempt to forecast price or just reacting to price, regardless, by looking at a price chart for even the briefest moment, we’re able to see the instrument’s historic moves, current direction, volatility, etc.
So what’s a chart pattern then? Well, chart patterns are simply shapes that are created by price movement, and it’s these shapes that give us context as to how an instrument is currently moving, and an insight as to potential upcoming moves.
But Why Charts?
The size of a particular chart pattern, or the moments in which it’s taking place can provide clues as to what the next movement in price could be if the chart pattern completes. This makes them an increasingly useful tool for any trader.
What’s a chart pattern?
There are two specific categories of chart patterns; Reversal Patterns and Continuation Patterns.
A reversal pattern is simply a signal that an end to a bull or bear trend is approaching or has occurred. Whereas a continuation pattern is an indication that the existing trend will continue.
To highlight these chart patterns, traders typically use trendlines, which are drawn by connect high and low wings on a chart. Typically, traders will use a bounce or break of these trendlines to signal a trade entry or exit.
There tends to be quite a bit of subjectivity when it comes to how trendlines are drawn, which can means that technical trading isn’t really an exact science. One person may see one thing, and another trader may see something completely different. One thing all technical patterns do have in common however, is that they indicate a well-defined area to exit a trade should it go against you.
Despite this subjectivity, new traders or those learning technical trading shouldn’t be discouraged if at first it’s hard to profit from chart patterns. It takes practice and experience to develop the skills required to trade any method, however you will in time discover the patterns that suit your trading personality the best, and also those that don’t really work for you.
Types of chart patterns
There are no shortage of different chart patterns, but perhaps the most popular of all is the Head and Shoulders Top pattern.
Head and Shoulders is a reversal pattern that signals the reversal of a trend.
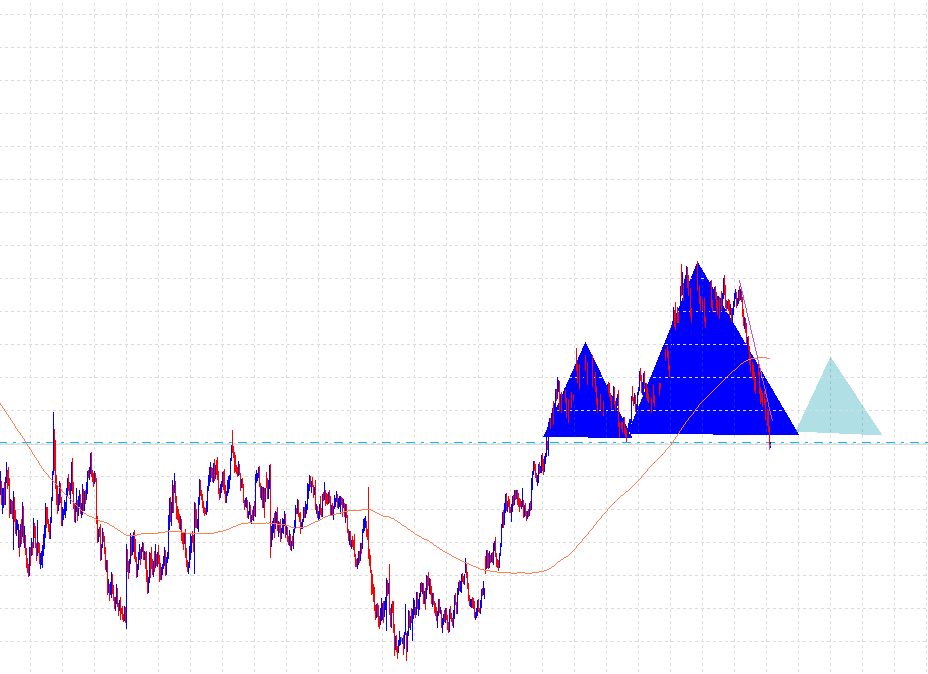
A Head and Shoulders (HS) Top forms when the price of an instrument makes a recent high, retraces, then makes a higher high, retraces, and then makes a lower swing high. Simply put it looks like a shoulder – head – shoulder. See the reference below.
When a HS top occurs, we then connect the two lows in the pattern with a trendline, which forms the ‘neckline’ of the pattern. When price crosses underneath the neckline, traders will look to enter a short position. Ideally, the neckline will have a downward slope, as it’s nice to see the low of the head undercut the left shoulder lows, however this isn’t a hard and fast rule. When price breaks through the neckline, it’s referred to as a breakout, and the HS Top pattern is confirmed, ideally resulting in price falling lower.
When trading the HS Top, traders should place their stop above the high of the right shoulder. Why? Often once the pattern is completed or confirmed, price will retrace back to the breakout area (neckline) before continuing its downward momentum. Placing our stop above the right shoulder reduces the chance of the trade being stopped out by a natural retracement. Whereas if price moves upward and takes out our stop, it’s very likely our HS Top pattern is invalidated.
To determine a potential price target when trading a HS Top pattern, we take the height of the pattern (neckline – top of head), and then subtract that from the breakout price. Of course there are many methods of determining a profit area, although typically with Technical Analysis, a profit area tends to be a measured move that’s outlined by the size of the chart pattern in which you’re trading.
So, the explanation for the HS Top pattern is that uptrends make continuous higher highs, and high lows. As soon as the pattern completes, price has failed to make a higher high, and the right shoulder of our pattern is now a lower high, potentially followed by a lower low at the breakout point (neckline). Because this lower low breaks the uptrend pattern (higher highs and lower lows), we can assume that the uptrend has run its course and the signs of a downtrend have emerged.
As you can assume, an Inverse Head and Shoulders pattern, or IHS Bottom is the opposite of the HS Top, and is often found at the bottom of a downtrend, acting as a reversal into a new bullish trend.
Trading HS patterns
Our measured move target area is just an estimate of a target area. No one can predict the price action of the forex market, and as such price may or may not reach the target, it could explode well beyond the target, etc. Although target areas are a good practice to have in place, you can always use your discretion to take profits, or take partial profits and let the remaining free-carry position run, or whatever suits your methodology.
One of the drawbacks, despite the probability of HS patterns is the risk/reward (R/R) ratio. This all depends on the size of the right shoulder of the pattern, because this is what determines our stop loss. A trader would be wise to exercise their discretion here in trading HS patterns that have an expected payoff of at least twice their risk, or 2R (refer to our post ‘Risk in R multiples’ here)
Fast & easy account opening
-
Register
Choose an account type and submit your application
-
Fund
Fund your account using a wide range of funding methods.
-
Trade
Access 300+ CFD instruments across all asset classes on MT4 / MT5
That's it, it's that easy to open a Forex and CFD trading account.
Welcome to the world of trading!
open live account

About us
Vantage is a global, multi-asset broker offering clients access to a nimble and powerful service for trading CFDs on Forex, Commodities, Indices, Shares, and Cryptocurrencies.
With more than 10 years of market experience and headquartered in Sydney, Vantage now has over 1,000 staff across more than 30 global offices.
Vantage is more than a broker. It provides a trusted trading ecosystem that enables clients to achieve their own success, in a faster and simpler manner.
Be empowered to better capitalise on winning market opportunities when you trade smarter @vantage.