A Brief Breakdown of Forex Chart Patterns
Whether you’ve been trading the Forex market for a long time or a quite new to it, chances are you’ve heard about chart patterns and the importance of technical analysis. Today, we’ll go through the most important chart patterns in Forex to give you a starting point in increasing your knowledge of trading technical chart patterns.
First, let’s explain a little bit about what chart patterns actually are. Forex chart patterns are based on the price action of a particular asset/currency pair/etc, that either provides a higher than average probability of price moving in a particular direction, and/or offers a great risk reward potential for a trade. These chart patterns are clues to helping determine the potential for price to push towards a predefined target area that traders can take advantage of.
Types of chart patterns
Forex trading patterns are generally split into three categories depending on the potential direction indicated by the pattern itself. The first category we’ll cover is continuation chart patterns.
A trend continuation pattern is exactly what the name suggest, a pattern that suggest price will continue in the direction in which it’s been trending. If you see a continuation pattern (which we’ll discuss further on in this article), it means that price is in a short term correction.
The next type of pattern we’ll cover is reversal chart patterns. A reversal pattern will reveal itself at the end of a trend. In many cases if you see a reversal pattern forming when price is trending, we can expect that price will reverse if the reversal pattern is confirmed.
Finally, we have neutral chart patterns. Now, these chart patterns are likely to push the price towards a new move, however the direction of price movement is unknown until price actually breaks out in either direction. Neutral chart patterns tend to appear during both trending and consolidation periods. This might sound confusing, but these neutral patterns can be quote valuable because they can still present some great trades, and all you have to do is open a position in the direction that price breaks out.
Below is a list a few of the most common technical Forex chart patterns and their potential direction.
| Chart Pattern | Occurs when? | Type of signal | Probable Direction | What it looks like |
| Double top | Uptrend | Reversal | Down | 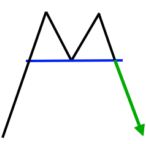 |
| Double bottom | Downtrend | Reversal | Up | 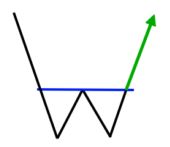 |
| Head and shoulders | Uptrend | Reversal | Down | 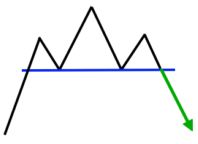 |
| Inverse Head and Shoulders | Downtrend | Reversal | Up | 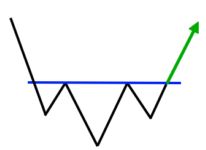 |
| Rising Wedge | Downtrend | Continuation | Down | 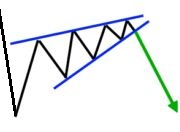 |
| Rising Wedge | Uptrend | Reversal | Down | 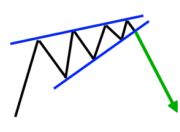 |
| Falling Wedge | Uptrend | Continuation | Up | 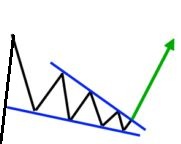 |
| Falling Wedge | Downtrend | Reversal | Up | 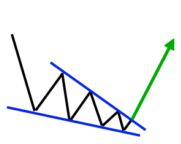 |
| Bearish Rectangle | Downtrend | Continuation | Down | 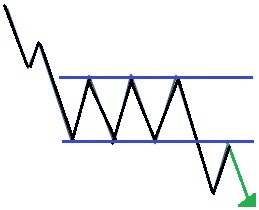 |
| Bullish Rectangle | Uptrend | Continuation | Up | 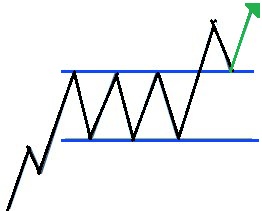 |
| Bearish Pennant | Downtrend | Continuation | Down | 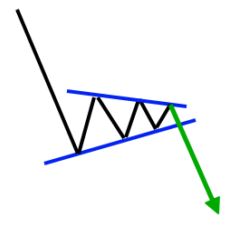 |
| Bullish Pennant | Uptrend | Continuation | Up | 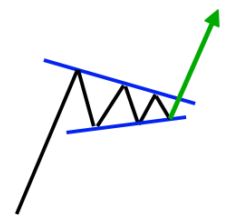 |
| Ascending Triangle | Both | Neutral | Both (Up Bias) | 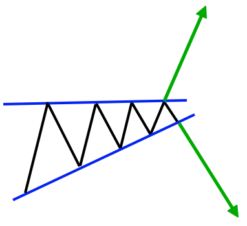 |
| Descending Triangle | Both | Neutral | Both (Down Bias) | 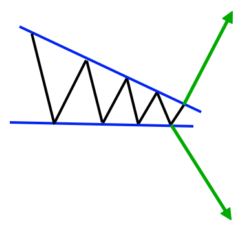 |
| Symmetrical Triangle | Both | Neutral | Both | 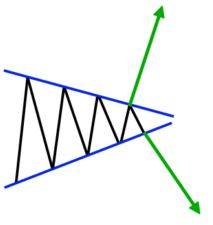 |
| Symmetrical Expanding Triangle | Both | Neutral | Both | 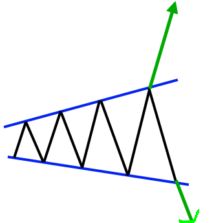 |
As you can see, these patterns are a crucial part of trading price action in the forex market. They tend to represent the accumulation and distribution of price (which reveals itself as consolidation) that comes after or during a trend in any direction. Then, after this consolidation is completed (the buying and selling by the big banks), the price often breaks out resulting in a significant move.
It’s can be hard to recognise these patterns if you’re quite new to Forex trading, however with practice you’ll find it easier and easier to spot them live on a chart. Feel free to bookmark this ‘cheat sheet’ and use it for reference because technical chart patterns are a tried & tested system used by many professional traders, and a welcome addition to any new trader’s strategy.
I hope you enjoyed reading this brief introduction to popular Forex chart patterns. Have a great week, traders.
Fast & easy account opening
-
Register
Choose an account type and submit your application
-
Fund
Fund your account using a wide range of funding methods.
-
Trade
Access 300+ CFD instruments across all asset classes on MT4 / MT5
That's it, it's that easy to open a Forex and CFD trading account.
Welcome to the world of trading!
open live account

About us
Vantage is a global, multi-asset broker offering clients access to a nimble and powerful service for trading CFDs on Forex, Commodities, Indices, Shares, and Cryptocurrencies.
With more than 10 years of market experience and headquartered in Sydney, Vantage now has over 1,000 staff across more than 30 global offices.
Vantage is more than a broker. It provides a trusted trading ecosystem that enables clients to achieve their own success, in a faster and simpler manner.
Be empowered to better capitalise on winning market opportunities when you trade smarter @vantage.