Using Momentum to Trade Forex
Whether you’re a scalper, swing trader or investor, the momentum indicator is a highly underrated tool suitable for almost all forex trading strategies, because unlike many other common indicators, it doesn’t repaint.
What is the Momentum Oscillator?
The momentum indicator is one of MT4’s default indicators. It shows the difference between a candles closing price and the price of a specific period back, by default, 14. The momentum indicator then compares these values with the 100 level.
The chart below shows what the momentum indicator looks like on a NZDCAD Daily timeframe. You’ll notice that price crosses the 100 level quite frequently, and whilst you could simply trade every cross, there are far better ways to utilise the momentum indicator in your forex trading system.
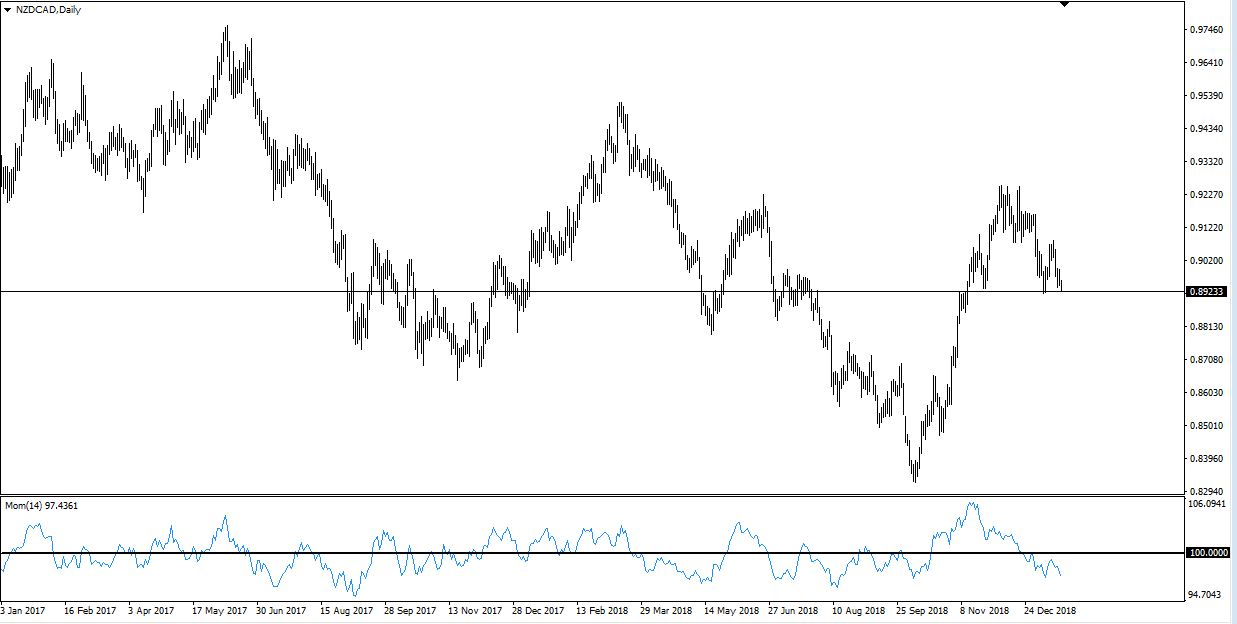
Instead, let’s consider the 100 level as our bull/bear level and also a method of indicating market volatility. The further away from the 100 level the indicator is, the higher the market volatility is, and the stronger the current trend is.
Momentum Trend Strategy
One method of trading with the momentum indicator as you’ll notice in the chart below, is as a simple trend trading strategy. As you’re likely aware, a trend can be defined as a series of higher highs and higher lows for bulls, and lower lowers and lower highs for bears.
By simply applying these laws of price action to the momentum indicator we can create a very robust strategy.
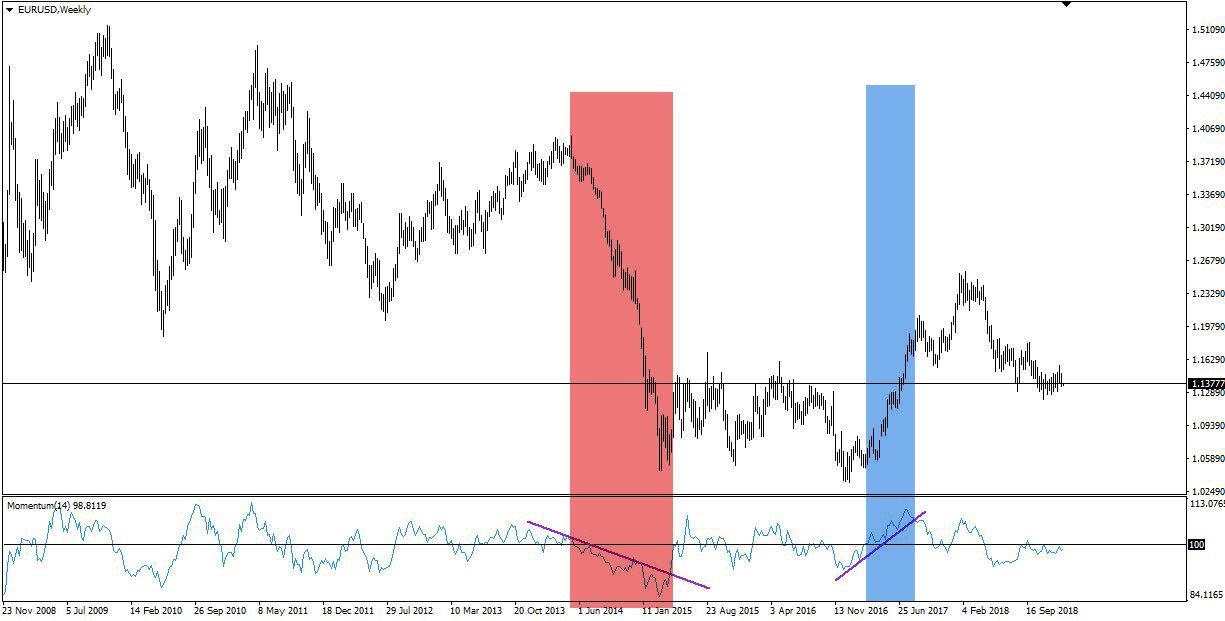
The EURUSD weekly chart above shows an example of how a trader can use price action rules to trade with the momentum indicator. First, we note whether we are above or below the 100 level, thus determining our trend.
Then, we start to see a series of lower lowers (red) and higher highs (blue) emerging. As in any trending market, a pullback is healthy, and both the 100 level and the trendlines drawn on the momentum indicator both offer traders a place to enter a trade in the direction of the prevailing trend.
Momentum Divergence Strategy
Various oscillators are used to show divergences, or differences between the indicator and price.
Divergences typically form around significant tops and bottoms.
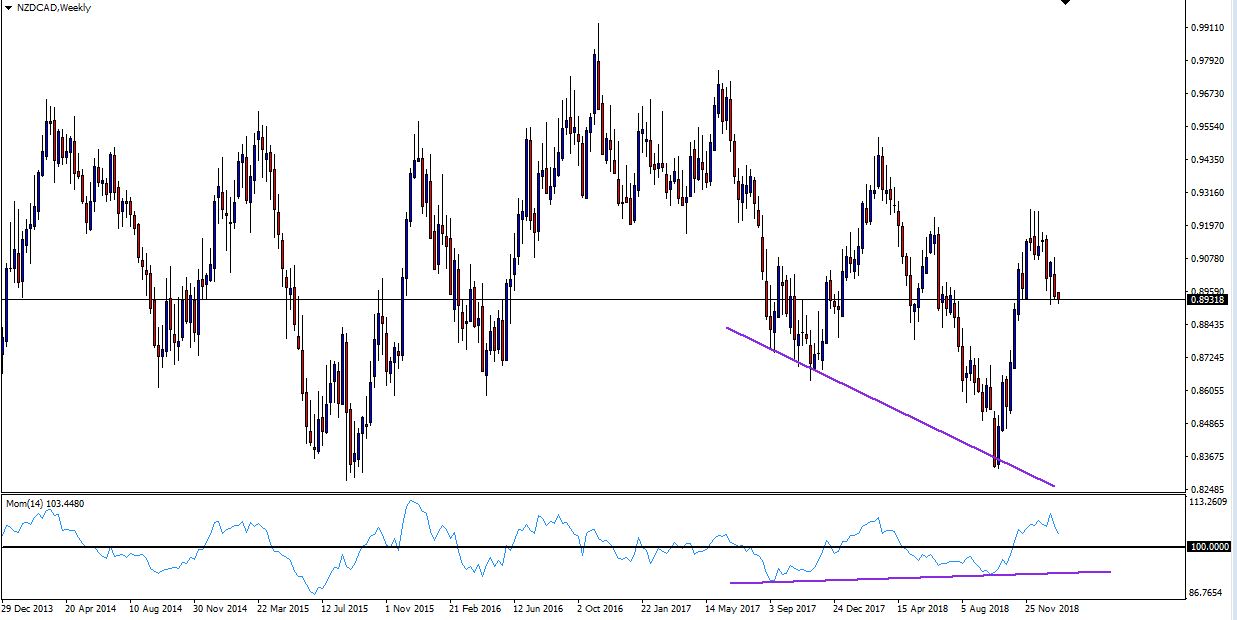
Higher highs and lower lows also feature prominently in this strategy. You can see that price formed a lower low on the chart, however the momentum indicator failed to do so, instead forming a higher low, which can mean that the current trend is running out of steam. This is where a trader would be looking to initiate a long position.
Wrapping up
Using the momentum indicator in your trading offers a little bit of everything. It follows price action, keeping you close to where the market is going. Even by just using the 100 level in your trading strategy to determine the current trend, you’ll adding an extra layer of robustness to your existing strategy.
Fast & easy account opening
-
Register
Choose an account type and submit your application
-
Fund
Fund your account using a wide range of funding methods.
-
Trade
Access 300+ CFD instruments across all asset classes on MT4 / MT5
That's it, it's that easy to open a Forex and CFD trading account.
Welcome to the world of trading!
open live account

About us
Vantage is a global, multi-asset broker offering clients access to a nimble and powerful service for trading CFDs on Forex, Commodities, Indices, Shares, and Cryptocurrencies.
With more than 10 years of market experience and headquartered in Sydney, Vantage now has over 1,000 staff across more than 30 global offices.
Vantage is more than a broker. It provides a trusted trading ecosystem that enables clients to achieve their own success, in a faster and simpler manner.
Be empowered to better capitalise on winning market opportunities when you trade smarter @vantage.