Trading confluence: Stack the odds in your favour

As I’ve touched on in the past, I’m a HUGE fan of using areas of confluence when it comes to Forex trading… or trading any market for that matter. Originally found in the stock market since pretty much forever, traders started noticing that price tends to form similar patterns prior to advances or declines.
Today, I’m going to go in-depth as to what I look for in terms of confluence areas utilising Forex trading concepts such as classical technical analysis, candlestick patterns, support and resistance, fundamental analysis, and then how we can combine these to find confluence areas to trade off.
What’s critical with trading confluence, is that we’re really looking for a trade with the least path of resistance. Speaking of resistance, support and resistance are two super key elements to look for when finding confluence areas.
When it comes to support and resistance, there are essentially two types, classic and dynamic. Classic support and resistance is really just horizontal lines that signify rejections from price action. Dynamic, however follows price often in the form of a trendline or significant MA.
So what do we look for?
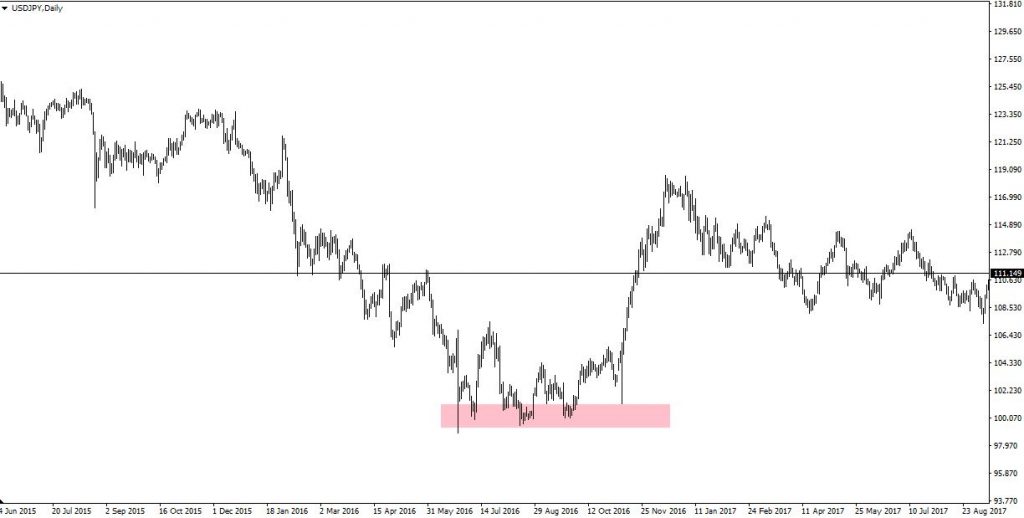
What we’re looking for with confluence is instances where support and resistance areas coincide with technical chart patterns. Take for example the image below, noticing the area of support highlighted.
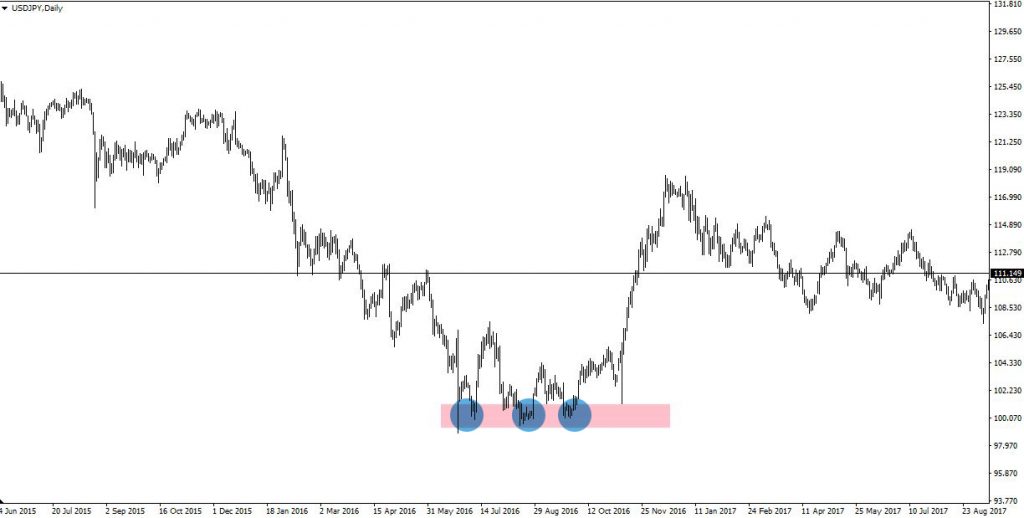
Now, we can also see that price has formed a triple bottom technical pattern.
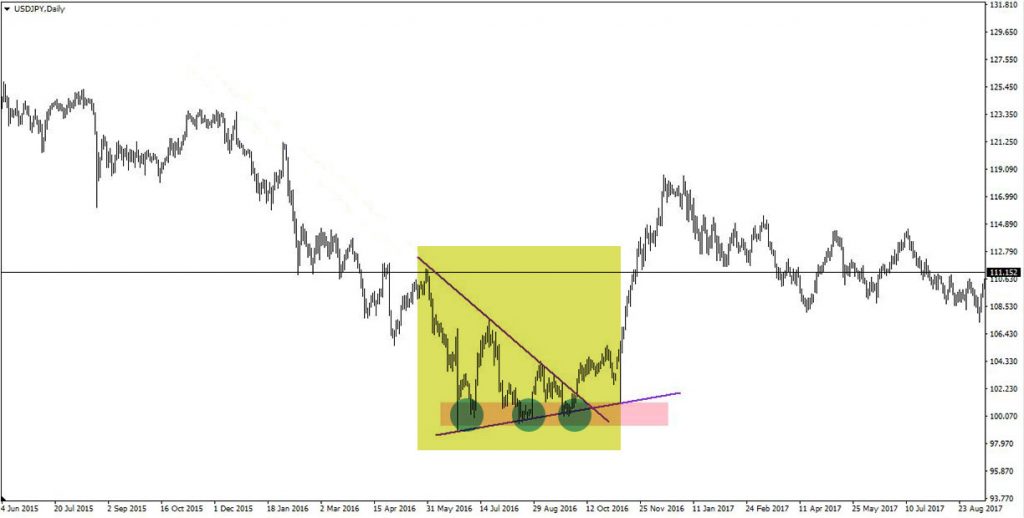
For additional confirmation, we also have a triangle reversal technical pattern.
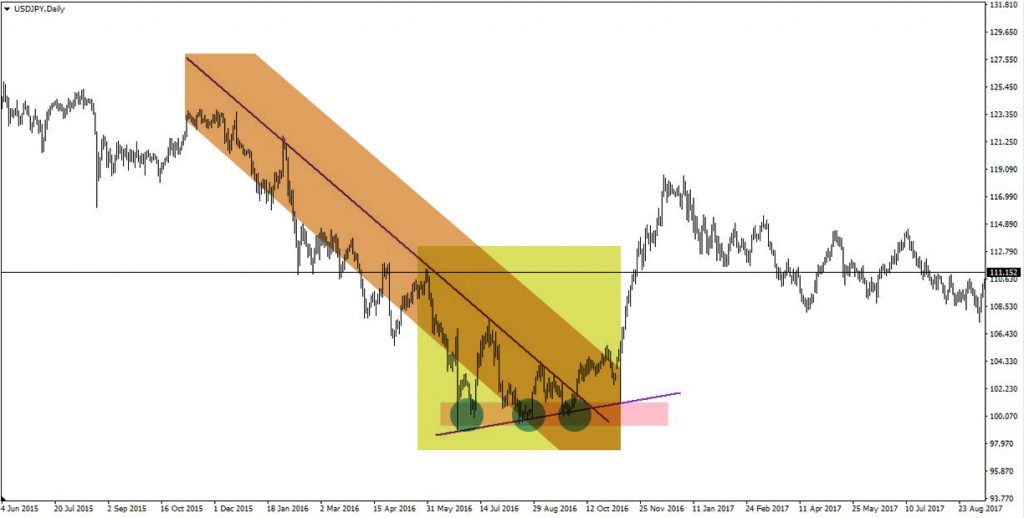
Next, you can notice that the triangle line also provides an area of dynamic resistance in the form of a trendline.
How do you trade confluence?
In the example above, there are a number of ways in which it could be traded. However he’s one in which the odds are stacked greater in our favour.
1. We wait for price to break through our upper triangle line / downward dynamic resistance trendline.
2. We set our stop loss just underneath the prior low / support / final low of the triple bottom pattern.
3. We can set a measured move target which would be the widest part of the triangle in length. We could also use the measure move target area of the triple bottom pattern which is the length of the highest bounce in the pattern from the high of the pattern. Or, alternatively use other established support and resistance areas, or even trail our stop loss and close the trade when the market reverses.
Out of all the possible profit target methods, the measured move from the triple bottom pattern gives us our largest fixed profit target.
In the above method, there are four factors at play that make this an area of confluence:
1. Classical Support
2. A Triple Bottom Pattern
3. A Triangle Pattern
4. Dynamic Resistance (Trendline)
I know in this example it seems that the stars aligned and created a perfect scenario, but when you know what to look for you’d be surprised how often you can spot confluence areas where 2-3 patterns occur at the same time.
Wrapping Up
Using confluence areas to trade are an extremely robust method of trading price action. When you stack the odds in your favour, you might not get signals all the time but you’ll certainly notice the reliability of the signals that do occur.
Fast & easy account opening
-
Register
Choose an account type and submit your application
-
Fund
Fund your account using a wide range of funding methods.
-
Trade
Access 300+ CFD instruments across all asset classes on MT4 / MT5
That's it, it's that easy to open a Forex and CFD trading account.
Welcome to the world of trading!
open live account


