Analysing Chart Patterns: Triangle patterns
For part four of our chart pattern series we’re going to be going into one of the most popular Forex trading patterns, the triangle. Triangles come in a variety of different categories and while they can be both continuation and reversal patterns, the majority tend to be continuation patterns. We’ll be covering three particular types of triangle patterns: ascending, descending. and symmetric.
Triangle patterns tend to form when the price of an instrument tightens up over time, as if volatility is compressing. If a trader draws a trendline along both the highs and the lows of a price chart the lines should converge toward each other, forming a triangle.
Trading Triangles
Since triangles can be both continuation and reversal patterns and can occur in both uptrends and downtrends, traders will need to wait for the breakout to take the trade so as to confirm whether the pattern is in fact a continuation or reversal pattern.
When drawing a triangle pattern, there MUST be at least two swing highs and two sing lows (as with any valid trendline). Sometimes, price will continue to make smaller swings, tightening up towards the apex of the triangle.
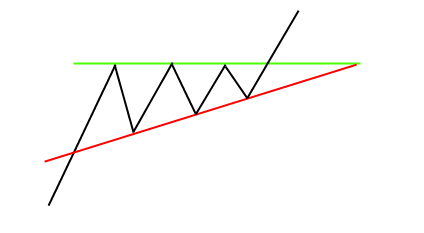
Ascending triangles form when the bottom trendline rises, while the top trendline remains horizontal. This shows increasing price pressure on the upside, while also forming a series of higher lows.
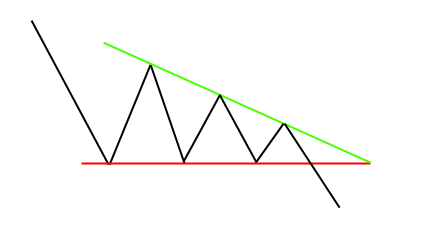
Descending triangles is the exact opposite – so the top trendline slopes downward while the bottom line remains horizontal.
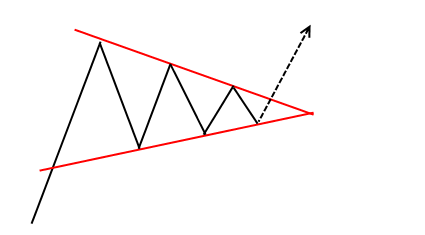
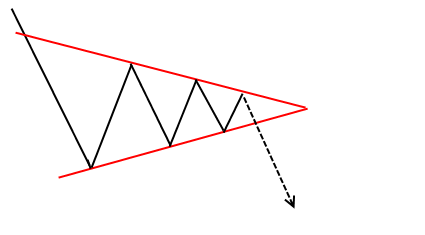
A symmetrical triangle forms when both trendlines move towards each other.
Each of the triangles shown above should only be traded when price breaks out of the pattern. It doesn’t really matter whether you draw the patterns based on the high/low or the open/close of a candle, but the results will vary slightly.
Traders can place their stop loss just outside of the triangle pattern, slightly below/above the previous swing high/low.
To find an approximate target area, we take the highest point of the triangle and add it to the breakout price, giving us an estimate of how far price can move from a confirmed breakout. We do this by using the first swing low and swing high of the pattern.
Seeing that continuation patterns tend to be more reliable than reversals, traders can be more selective with trading triangles by only trading in the direction of the greater trend. However, this is by no-means necessary as bias can harm a trader’s ability to place trades with conviction.
One of the great things about triangle patterns is that the RR is ALWAYS greater than 1:1 because our target is the maximum height of the pattern while the stop loss is always the smallest swing of the triangle, which makes it a very favourable pattern to trade the Forex market with.
Fast & easy account opening
-
Register
Choose an account type and submit your application
-
Fund
Fund your account using a wide range of funding methods.
-
Trade
Access 300+ CFD instruments across all asset classes on MT4 / MT5
That's it, it's that easy to open a Forex and CFD trading account.
Welcome to the world of trading!
open live account

About us
Vantage is a global, multi-asset broker offering clients access to a nimble and powerful service for trading CFDs on Forex, Commodities, Indices, Shares, and Cryptocurrencies.
With more than 10 years of market experience and headquartered in Sydney, Vantage now has over 1,000 staff across more than 30 global offices.
Vantage is more than a broker. It provides a trusted trading ecosystem that enables clients to achieve their own success, in a faster and simpler manner.
Be empowered to better capitalise on winning market opportunities when you trade smarter @vantage.