4 Indicators Every Forex Trader Should Know
When embarking on your forex adventure, you’ll soon see that there are a huge messy collection of different trading methods out there. However, in time, you’ll come to realise that you can uncover many trading opportunities by just sticking to one of four main chart indicators. So today, we’re going to chat about Moving Averages, RSI, Stochastic and the MACD indicators.
First, let’s have a bit of a chat about the misconceptions that a complex strategy is seldom a good one.
Forex traders tend to overcomplicate things when they’re first getting started in the forex market. For whatever reason people tend to think that the more moving parts a strategy has, the better it is, and unfortunately it can take a lot of damage to a trader’s account before they realise it’s far more profitable to keep things as simple as possible. Why? Because simplicity means less stress.
Before you get started
When looking at your MT4 or MT5 chart, you’ll notice there are two simple market conditions: A ranging market, or a trending market. Using technical analysis as a trader gives you the ability to identify which market conditions are present at a given time and thus find higher probability trade entries.
Moving Averages
One of the most popular indicators used in a variety of trading strategies is a moving average. A moving average can not only give traders a precise signal as to when to enter the market or quite simply, a method of determining the current trend of the market.
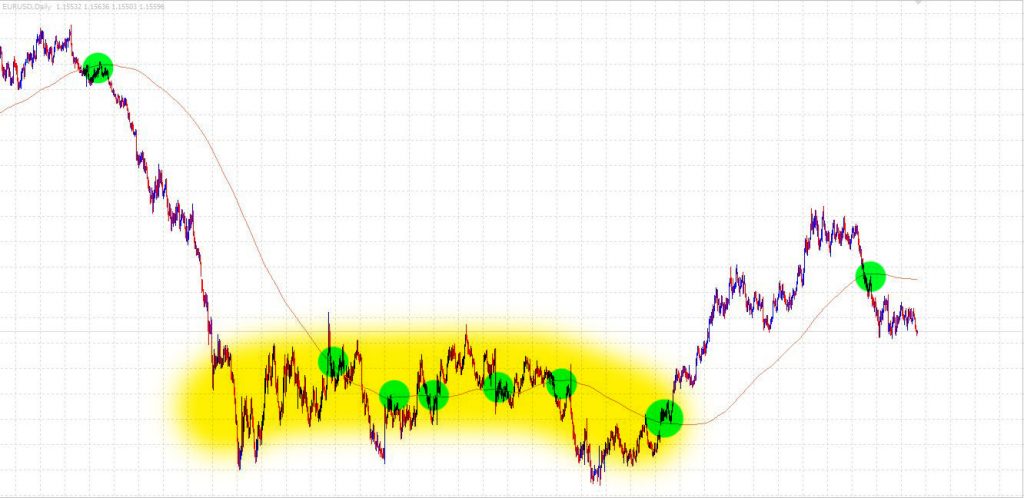
In this example we’ll take a look at how the 200MA is applied to a daily chart.
Consider the chart below:
You can see here that the 200MA defines the current trend based on its slope, ie. Upwards or downwards. You can also not there are some potential entry points shown where price passes through the 200MA. It’s also worth noting that during a choppy market (yellow highlight) can cause a series of small losses for a trader, however once you catch a big trend, the profits far outweigh the losses.
RSI
The RSI, or Relative Strength Index, is a simple oscillator that lets traders know when the market is potentially overbought or oversold, and could possibly be reversing soon. Those who prefer to try and ‘Buy Low’ and ‘Sell High’ might find this of use.
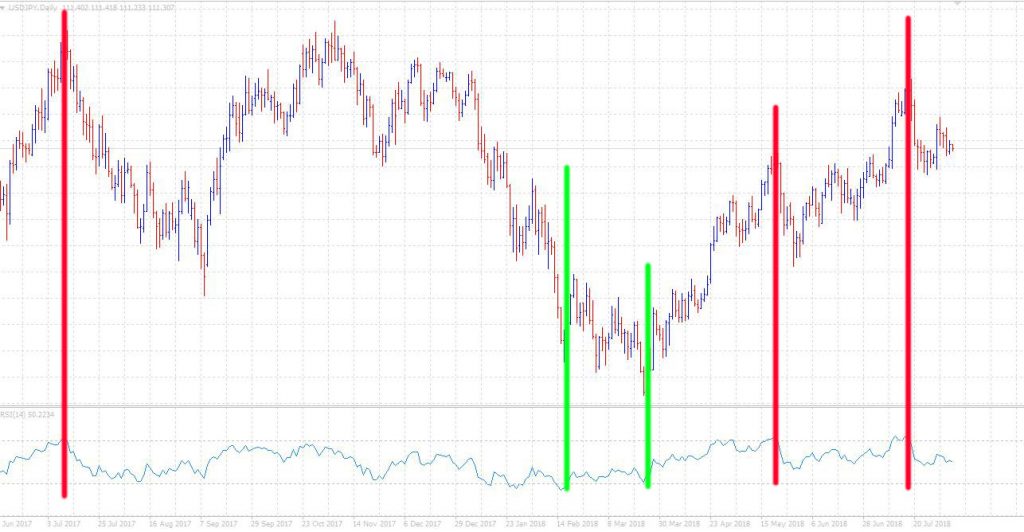
During both trending and ranging markets, traders can use the RSI to try and locate precise entries and exits. For instance many traders will try and use a retrace from the overbought and oversold levels to enter or exit a trade.
Consider the chart below:
You can see in the chart above, I’ve indicated potential entries and exits according to the RSI crossing its key levels. Red indicates a short trade and green indicates the long trade entries. Again, no entry will ever be a guaranteed winner, however you can see the potential of utilising the RSI for trade entries.
Stochastics
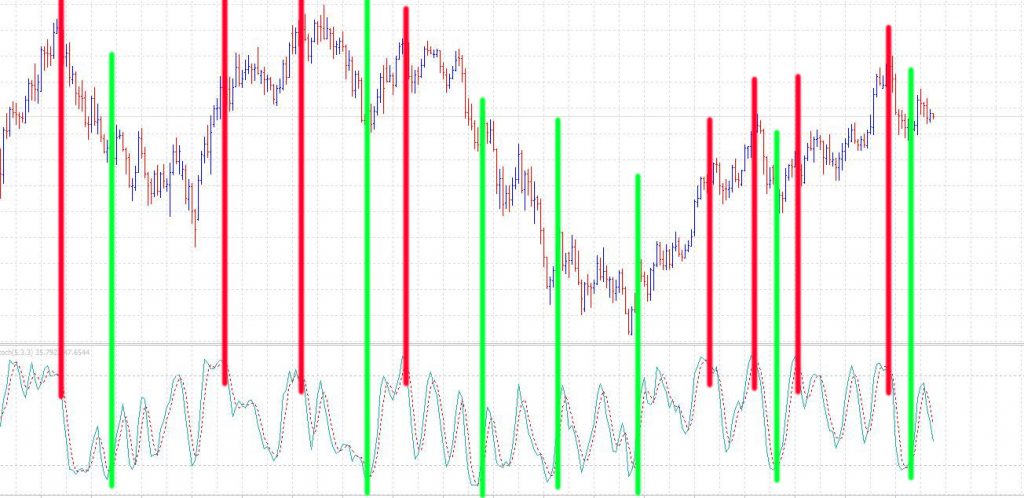
Similar to the RSI, stochastics can help a trader find overbought or oversold levels that can indicate a reversal in price. Again, much like the RSI we look to time entries when the line crosses through the extreme levels, and the crossing of the two lines %K and %D.
Consider the chart below:
MACD
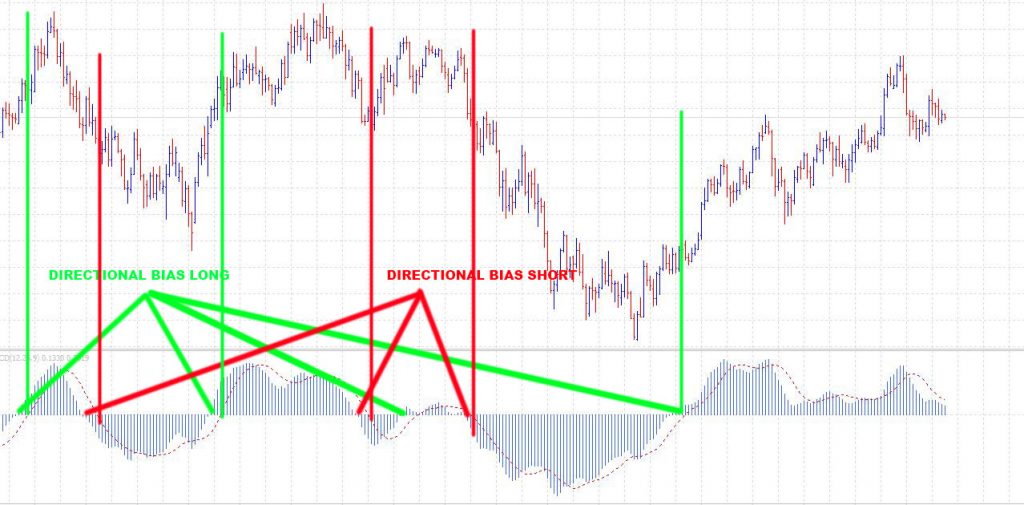
Last but not least, we’re going to look at the MACD. The MACD indicator determines changes in momentum. So after you’ve identified whether the market is trending or ranging, you want to look for where the histogram is in relation to the ‘ZERO’ line, which indicates your directional bias.
After you’ve done this, you can use the crossing over of the two moving average lines to signal a buy or sell entry, depending on your directional bias.
Looking at the chart above, as mentioned we need to determine our directional bias (indicated by diagonal lines) by whether the histogram is above or below the Zero line.
Once this is confirmed we can use the MA crossover (indicated by vertical lines) as our entry.
Conclusion
As mentioned, there is no 100% perfect trading strategy and losses do occur, however you can see from the indicators above just how simple it can be to arm yourself with a profitable trading strategy.
So why not open a demo account with Vantage and see how you can start trading using any of the above indicators today using MetaTrader 4.
Fast & easy account opening
-
Register
Choose an account type and submit your application
-
Fund
Fund your account using a wide range of funding methods.
-
Trade
Access 300+ CFD instruments across all asset classes on MT4 / MT5
That's it, it's that easy to open a Forex and CFD trading account.
Welcome to the world of trading!
open live account


