Fibonacci and the Forex Market
Fibonacci retracements are a fairly common and long-standing method of establishing swing highs and lows as well as forecasting potential key levels in price. But before we get into how Fibonacci can be applied to the Forex market, let’s get into the history of who, how and why.
The Man Behind It All – Mr Leonardo Fibonacci

Way back in the 13th century, there was an Italian fella named Leonardo Fibonacci, who had a ‘Aha’ moment when he found that a few numbers created ratios that described the natural proportions of all things in the universe. Wait… all things, you ask?
Fibonacci levels have been around for eons, even before Forex trading was a thing. Fibonacci had discovered that these ratios coincided with things like the spirals of snail shells, the pattern of seeds in plants, tree branch formations, even human faces.
So how did these levels come about?
Fibonacci sequences are actually simpler than you might think. They’re nothing more than a series of numbers, as follows:
0, 1, 1, 2, 3, 5, 8, 13, 21, 34, 55, 89, 144, and so on.
What you might notice about these numbers is that each number is the sum of the previous two numbers. Ie. 0+1=1, 1+1=2, 2+1=3, and so on.
Now, this sequence of numbers can continue infinitely, and you’re probably asking yourself “what’s so great about a bunch of numbers”. Well, this is where the real magic happens. Every number in this sequence is around 1.618 times that of the previous number. And what’s so special about 1.618? This, my friends is known as the ‘golden ratio’, or ‘golden mean’, or in regards to Forex trading, the 61.8% level.
But what about the 38.2% and 23.6% levels? Well, the 38.2% level is found by dividing a number by the number two places ahead. Ie. 13/34 = .382
0, 1, 1, 2, 3, 5, 8, 13, 21, 34, 55, 89, 144, etc.
And for the 23.6% ratio we divide a number by that of the number three places ahead. Ie. 13/55 = .236
0, 1, 1, 2, 3, 5, 8, 13, 21, 34, 55, 89, 144, etc.
So now we have our three Fibonacci retracement levels, but why are they so special? Well, just as in nature, in the Forex market, these levels seem to have a role in where price may reverse. Of course, nothing is for certain, but when traded correctly, these levels can present an attractive R:R (read our article on R ratios here) trade setup when coinciding with a price action signal such as a reversal candle.
Let’s take a look at a chart.
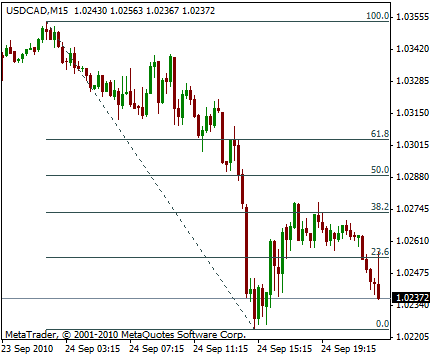
So, we begin by selecting the Fibonacci tool from our MetaTrader 4 or MetaTrader 5 platform and draw from the most recent swing high/low to the left of our chart to the prior swing high/low, depending on the direction of the trend. Notice how price seems to struggle breaking upwards of the 38.2% level, and also hesitates somewhat around the 23.6% level.
There’s a lot more to Fibonacci than I’ve covered here, but have play with the Fib tool on your MT4 or MT5 platform and you’ll notice that the market tends to respect Fibonacci ratios quite consistently.
Fast & easy account opening
-
Register
Choose an account type and submit your application
-
Fund
Fund your account using a wide range of funding methods.
-
Trade
Access 300+ CFD instruments across all asset classes on MT4 / MT5
That's it, it's that easy to open a Forex and CFD trading account.
Welcome to the world of trading!
open live account

About us
Vantage is a global, multi-asset broker offering clients access to a nimble and powerful service for trading CFDs on Forex, Commodities, Indices, Shares, and Cryptocurrencies.
With more than 10 years of market experience and headquartered in Sydney, Vantage now has over 1,000 staff across more than 30 global offices.
Vantage is more than a broker. It provides a trusted trading ecosystem that enables clients to achieve their own success, in a faster and simpler manner.
Be empowered to better capitalise on winning market opportunities when you trade smarter @vantage.